Department of Transportation
Bureau of Transportation Statistics
The Freight Transportation Services Index (TSI), which is based on the amount of freight carried by the for-hire transportation industry, rose 0.8 percent in May from April, seasonally-adjusted, rising after one month of decline, according to the U.S. Department of Transportation’s Bureau of Transportation Statistics’ (BTS). The May 2015 index level (122.7) was 29.6 percent above the April 2009 low during the most recent recession.
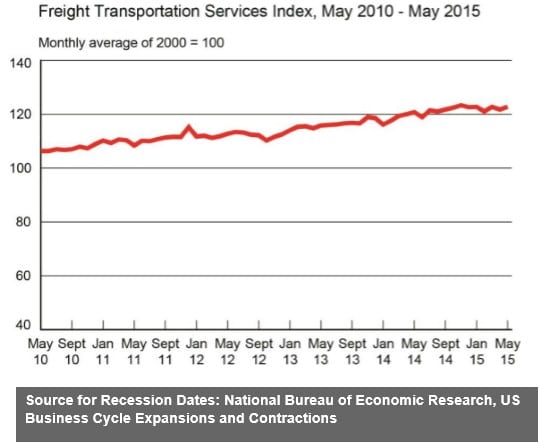 The level of freight shipments in May measured by the Freight TSI (122.7) was 0.5 percent below the all-time high level of 123.3 in November 2014 BTS’ TSI records began in 2000. See historical TSI data.
The April index was revised to 121.7 from 120.4 in last month’s release but remains below the March index. The indexes for December through March were also revised up slightly.
The Freight TSI measures the month-to-month changes in freight shipments by mode of transportation in tons and ton-miles, which are combined into one index. The index measures the output of the for-hire freight transportation industry and consists of data from for-hire trucking, rail, inland waterways, pipelines and air freight.
Analysis: There was a large increase in trucking, reversing an April decline. Waterborne also rose along with a smaller increase in pipeline. These increases outweighed declines in air freight, rail carloads, and rail intermodal to produce the 0.8 percent rise in the overall freight index in May. Personal income and employment increased in May, even as the Federal Reserve Board Industrial Production index and, manufacturers’ shipments declined. Revised data indicates that GDP declined in the first quarter of 2015, when the growth of the freight TSI slowed.
Trend: In May, the Freight TSI returned to its March level. Since peaking in November 2014, the index has alternated months of increases and decreases that left it still near the all-time high but 0.5 percent lower than in November, and at the same level as in January 2015. After dipping to 94.6 in April 2009, the index rose 29.6 percent in the succeeding 73 months. For additional historical data, go to TSI data.
Index highs and lows: Freight shipments in May 2015 (122.7) were 29.6 percent higher than the recent low in April 2009 during the recession (94.6). The May 2015 level was 0.5 percent below the historic peak reached in November 2014 (123.3).
>> Click here to access the entire press release from the U.S. Department of Transportation.