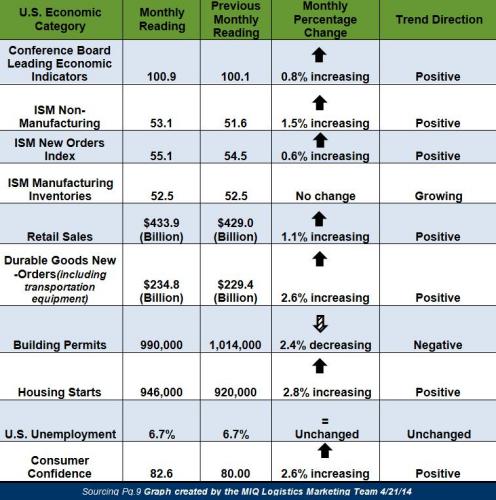
“The LEI rose sharply again, the third consecutive monthly increase,” said Ataman Ozyildirim Economist at The Conference Board. “After a winter pause, the leading indicators are gaining momentum and economic growth is gaining traction. While the improvements were broad-based, labor market indicators and the interest rate spread largely drove the March increase, offsetting the negative contribution from building permits. And, for the first time in many months, the consumer outlook is much less negative.”
Institute for Supply Management (ISM) Manufacturing Report on Business
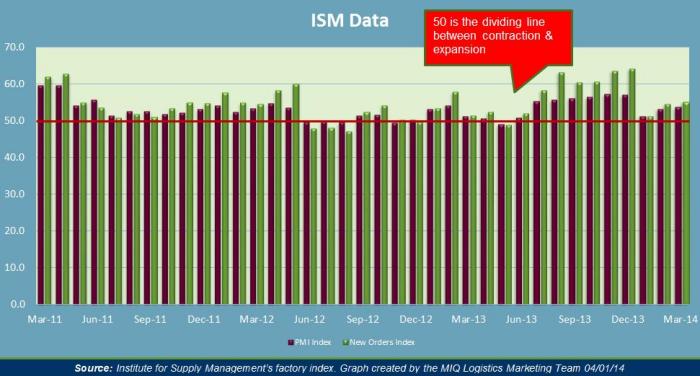
Economic activity in the manufacturing sector continued to climb in March
- 50 represents the dividing line between expansion and contraction for the index of the below chart; which covers the Purchasing Managers Index (PMI) and new orders.
- The PMI registered 53.7% in March, which was 0.5% higher than February’s reading.
- New Orders increased in March by 0.6% to register 55.1.
Expanding Manufacturing Industries
- Petroleum & Coal Products
- Transportation Equipment
- Furniture & Related Products
- Paper Products
- Printing & Related Support Activities
- Plastics & Rubber Products
- Fabricated Metal Products
- Machinery
- Textile Mills
- Computer & Electronic Products
- Nonmetallic Mineral Products
- Food, Beverage & Tobacco Products
- Chemical Manufacturing
- Primary Metals
Contracting Manufacturing Industries
- Apparel, Leather & Allied Products
- Wood Products
- Electrical Equipment, Appliances & Components
- Miscellaneous Manufacturing
Transportation Market Update
| Truckload Index Category | Monthly Reading | Previous Monthly Reading | Trend Direction |
| American Trucking Associations (SA) seasonally adjusted For-Hire Truck Tonnage | 127.6 | 124.1 | + 2.8% Increasing |
| Cass Freight Index Report Shipments | 1.144 | 1.073 | + 6.6% Increasing |
| Cass Freight Index Report Expenditures | 2.549 | 2.419 | + 5.4% Increasing |
| Freight Transportation Services Index (TSI) | 115.2 | 113.6 | + 1.2% Increasing |
| Trucking Employment | 3,300 jobs added | 100 jobs added | = Unemployment Rate Unchanged |
| NAFTA Statistics for August | 57.2% of the $90.1 Billion of U.S. – NAFTA trade was transported by truck in December; this is up 7.2% YOY | ||
“The amount of freight carried by the for-hire transportation industry rose 1.2 percent in February from January, rising after two consecutive monthly declines, according to the U.S. Department of Transportation’s Bureau of Transportation Statistics’ (BTS) Freight Transportation Services Index (TSI).”
“It is pretty clear that winter weather had a negative impact on truck tonnage during February,” said ATA Chief Economist Bob Costello. “However, the impact wasn’t as bad as in January because of the backlog in freight due to the number of storms that hit over the January and February period.”
“March shipment volume increased 6.6 percent over the prior month, on top of the 7.3 percent rise seen in February. The number of shipments was 0.4 percent higher than last March and 4.6 percent higher than in March of 2012”. – www.cassinfo.com
Global Market Update
Recent Updates from National Retail Federation and Hackett Associates
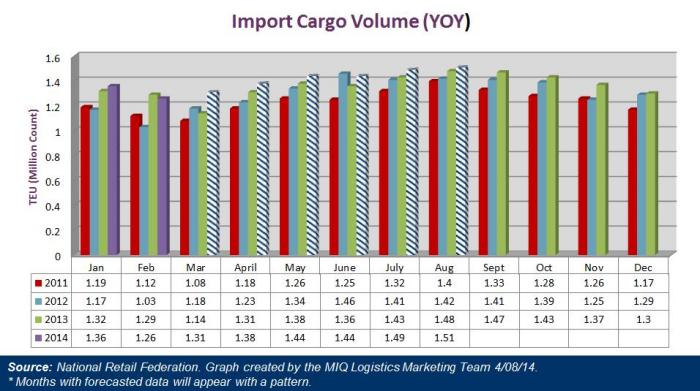
- U.S. ports followed by Global Port Tracker are forecasted to handle 1.31 million TEU for the month of March, and 1.38 million TEU for the month of April that is 15% and 6.1% YOY increases respectively.
- “With winter over, retailers are stocking up in anticipation of a busy spring and summer,” NRF Vice President for Supply Chain and Customs Policy Jonathan Gold said in a statement. “Consumers can expect plentiful supplies of merchandise. A busy time is expected over the next few months, so retailers are keeping a close eye on the labor situation at West Coast ports to ensure that cargo continues to move smoothly.”
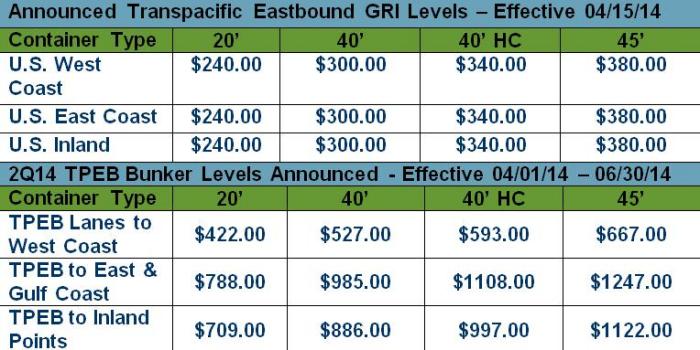
Transpacific Eastbound
The 5/1/14 GRI will conincide with Transpacific Eastbound contracts which run May 1st – April 30th.
Sources
Domestic & Global Economy
- “March 2014 Manufacturing ISM Report on Business” – www.ism.ws 04/01/14
- “March 2014 Non-Manufacturing ISM Report on Business” – www.ism.ws 04/03/14
- “The Conference Board Leading Economic Index (LEI) for the U.S. Increased in March” – www.conference-board.org 04/21/14
- “Advance Monthly Sales for Retail and Food Services March 2014” – www.census.gov 04/14/14
- “New Residential Construction in March 2014” – www.census.gov 04/16/14
- “Employment Situation Summary” – www.bls.gov 04/04/14
- “United States Consumer Sentiment” – www.tradingeconomics.com 04/11/14
- “Advance Report on Durable Goods Manufacturers’ Shipments, Inventories and Orders March 2014” – www.census.gov 04/24/14
Truckload Capacity & Volumes
- “Cass Freight Index Report” – www.casssinfo.com – Mar 2014
- “ATA Truck Tonnage Index Jumped 2.8% in February” – www.truckline.com 03/18/14
- “Three of Five Modes Carried More U.S.-NAFTA Trade in December 2013 than in December 2012” – www.rita.dot.gov 02/27/14
- “Freight Shipments Rose 1.2% in February from January” – www.rita.dot.gov 04/09/14
- “BTS says freight shipments rose 1.2% in February from January” – www.thetrucker.com 04/09/14
- “Jobs added at solid pace; for-hire trucking picks up 3,300” – www.thetrucker.com 04/04/14
Global Market Update
- “Port Tracker report is positive with warmer weather coming” – www.logisticsmgmt.com 04/08/14
- “Retail Imports To Increase 6.1% Percent in April” – www.nrf.com 04/07/14
- “Drewry: Asia-US Rate Gain Falls Short of Proposed Hike” – www.joc.com 04/16/14
- “Retailers Urge Expedited Contract Negotiations at West Coast Ports” – www.nrf.com 04/14/14