Source: Cass Information Systems
Both the Shipments and Expenditures Indexes have now been positive for four months in a row. Throughout the U.S. economy, there is a growing number of data points suggesting that the economy continues to get slightly better. Some data points are simply less bad, but an increasing number of them are better, and even a few are becoming outright strong. The 4.0% year-over-year (YoY) increase in the April Cass Shipments Index is yet another data point which suggests that the first positive indication in October may have indeed been a change in trend. In fact, it now looks as if the October Cass Shipments Index, which broke a string of 20 months in negative territory, was one of the first indications that a recovery in freight—or at least a change in trend—had begun.
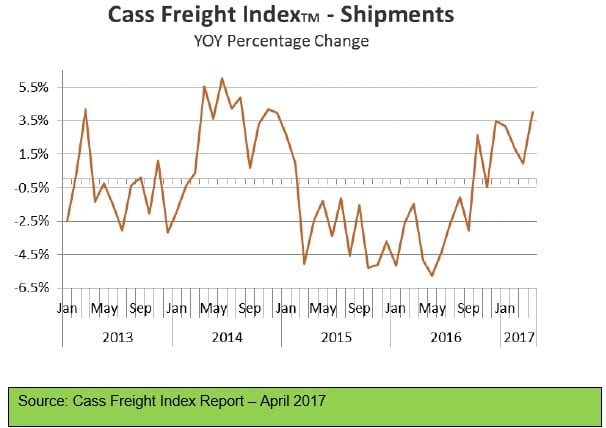
The 4.0% April YoY change looks very promising, but we should point out that April 2016 was down 4.9%, and that was on top of April 2015 which was down 2.5% ,and hence serves as an easy comparison.
Data is suggesting that the consumer is finally starting to spend a little, albeit not with brick and mortar retailers. It also suggests that, with the surge in the price of crude in October of last year, the industrial economy’s rate of deceleration first eased and then began a modest improvement led by the fracking of DUCs (drilled uncompleted wells), especially in the fields with a lower marginal production cost (i.e. Permian and Eagle Ford). We have been questioning, “How fast will the recovery from here be?” However, the overall freight recession, which began in March 2015, appears to be over and, more importantly, freight seems to be gaining momentum in most segments.
The April sequential pattern was also promising. March is traditionally a stronger seasonal month so the 3.7% sequential improvement is noteworthy. Viewing the shipments index on a nominal basis (in the chart below) highlights that the data in general is getting better.