Source: Cass Information Systems
Both the Shipments and Expenditures Indexes have now been positive for three months in a row. Throughout the U.S. economy, there are a growing number of data points suggesting that the economy is getting better. Some data points are simply less bad, but an increasing number of them are better, and even a few are becoming outright strong. The 0.9% YoY increase in the March Cass Shipments Index is yet another data point which suggests that the first positive indication in October may have indeed been a change in trend. In fact, it now looks as if the October Cass Shipments Index, which broke a string of 20 months in negative territory, was one of the first indications that a recovery in freight had begun in earnest.
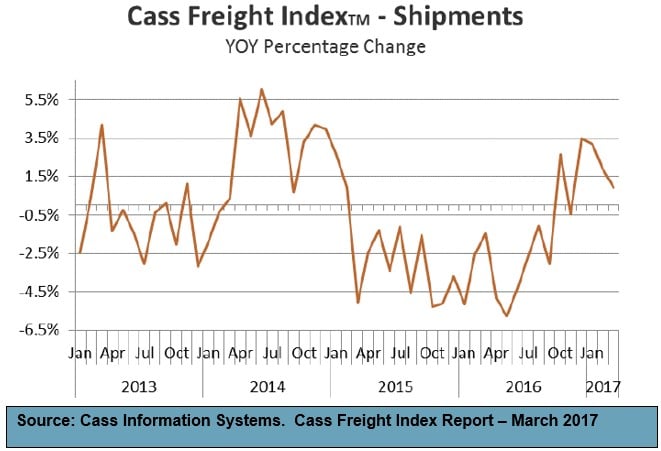
Although the 0.9% March YoY change looks weaker than the 1.9% February YoY change, we should point out that March 2016 was one of the least negative months for the shipments index and hence serves as a tougher comparison. Data is suggesting that the consumer is finally starting to spend a little, albeit not with brick and mortar retailers. It also suggests that, with the surge in the price of crude in October of last year, the industrial economy’s rate of deceleration first eased and then began a modest improvement led by the fracking of DUCs (drilled uncompleted wells), especially in the fields with a lower marginal production cost (i.e. Permian and Eagle Ford). We have been questioning, “How fast will the recovery from here be?” However, the overall freight recession, which began in March 2015, appears to be over and, more importantly, freight seems to be gaining momentum.
Unlike in February, the March sequential pattern was less inspiring. Instead it appears that January was well below trendline, February was well above, and March simply settled in near the true trendline (sequentially January down 6.4%, February was up 7.0%, and March was up 0.5%). Viewing the shipments index on a nominal basis (in the chart below) highlights that the data in general is getting better.
The Cass Freight Expenditures Index also continued to signal a turn in trend. Expenditures (or the total amount spent on freight) turned positive for the first time in 22 months in January, albeit against an easy comparison. Not since 2011—when the economy was still climbing out of the recession—had this index been so low. Our Expenditures Index in January 2016 was the worst in five years, as demand had weakened and crude oil had fallen below $30 a barrel. Although February and March of 2016 were also weak, they were not nearly as weak as January 2016 and hence a slightly tougher comp. Since fuel surcharges are included in the Expenditures Index, fuel was a negative bias in the data last year. Conversely, over the last several months, we have observed that part of the increase was a result of the steady increase in the price of fuel over the last seven months. But, we are also seeing some improvements in the pricing power of truckers and intermodal shippers. As an example, the proprietary Cass Truckload Linehaul Index (which measures linehaul rates and does not include fuel) only fell 0.9% on a YoY basis in the month of March, which was less than the 1.5% decline posted in November. The proprietary Cass Intermodal Price Index (which does include fuel) faired better, increasing 4.8% in March. This marked a continued acceleration from the 1.5% increase it posted in December and marked the sixth consecutive YoY increase after 21 consecutive months of decline (see those reports here for more details on the data and the underlying trends).
We should also remind readers of a fundamental rule of marketplaces: volume leads pricing. Repeatedly we have watched in a host of different markets, that volume goes up before pricing starts to improve and volume goes down before pricing starts to weaken. Even in markets as basic as the weather, the number of hours of sunshine (sunrise to sunset) starts to decline long before the temperature starts to fall.
>> Click here to read the entire Cass Freight Index report for March 2017.