“The modest rise in the Leading Economic Index in October follows the strong advances recorded in the prior two months, which helps lift the six-month annualized growth rate to 5.1 percent from 3.7 percent in the previous six months. The recent increase in the index supports our forecast that the U.S. economy is poised to grow somewhat faster at 2.3 in 2014 compared to 1.6 percent in 2013. Within the details, the sub-indexes contributing positively to growth are the financial, housing and manufacturing variables. Restraining growth is the ongoing caution of businesses that continue to keep tight reins on capital expenditures.”
– Kathy Bostjancic Director of Macroeconomic Analysis at The Conference Board

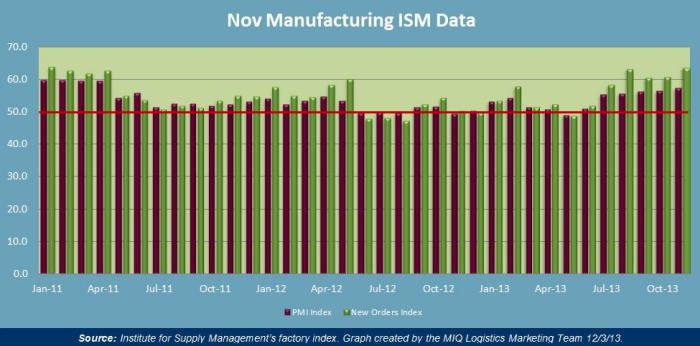
Institute for Supply Management (ISM) Manufacturing Report on Business
Economic activity in the manufacturing sector increased again in November
- 50 represents the dividing line between expansion and contraction for the index of the below chart; which covers the Purchasing Managers Index (PMI) and new orders.
- The PMI reading increased to 57.3% in November, which is the highest reading in 2013; the previous reading in October was 56.4%.
- New Orders increased in November by 3.0%; which raised the reading to 63.6%.
Expanding Manufacturing Industries
- Plastics & Rubber Products
- Textile Mills
- Furniture & Related Products
- Primary Metals
- Food, Beverage & Tobacco Products
- Paper Products
- Printing & Related Support Activities
- Petroleum & Coal Products
- Miscellaneous Manufacturing
- Electrical Equipment Appliances & Components
- Transportation Equipment
- Chemical Products
- Computer & Electronic Products
- Nonmetallic Mineral Products
- Fabricated Metal Products
Contracting Manufacturing Industries
- Apparel, Leather & Allied Products
- Wood Products
- Machinery
Transportation Market Update
| Truckload Index Category | Monthly Reading | Previous Monthly Reading | Trend Direction |
| American Trucking Associations (SA) seasonally adjusted For-Hire Truck Tonnage | 124.00 | 127.5 | – 2.8% Decreasing |
| Cass Freight Index Report Shipments | 1.105 | 1.116 | – 1.0% Decreasing |
| Cass Freight Index Report Expenditures | 2.524 | 2.508 | + .6% Increasing |
| Freight Transportation Services Index (TSI) | 114.3 | 115.1 | – 0.7 Decreasing |
| Trucking Employment | + 8400 Jobs | + 2400 Jobs | Positive |
| NAFTA Statistics for August | 59.4% of the $94.4 Billion of U.S. – NAFTA trade was transported by truck in September; this is up 5.4% YOY | ||
“Despite October’s month-to-month decrease, we saw a very robust year-over-year increase and I’m seeing some good signs out of the trucking industry that suggests the economy may be a little stronger than we think,” he said. “Specifically, the heavy freight sectors, like tank truck, have been helping tonnage this year. But in the third quarter, generic dry van truckload freight saw the best quarterly gains since 2010. I view this positively for the economy. I view it positively for trucking. Now, we have to see if it continues.”
– Bob Costello ATA Chief Economist
GLOBAL MARKET UPDATE
Recent Statements from National Retail Federation and Hackett Associates
- U.S. Imports handled 1.43 million TEU in October, which was up 6.4% YOY from October 2012.
- According to the recent edition from Port Tracker from the National Retail Federation (NRF) and maritime consultancy Hackett Associates, the report shows that August through September cumulatively accounted for 4.35 million cargo containers, which was up 4.3% YOY for the same two months in 2012.
- 2013 is expected to finish off with 16.2 million total TEU’s imported, which would be up 2.3% up from 2012, when the count was at 15.8 million TEU.
- NRF has predicted that 2013 holiday sales will be up 3.9% annually; reaching $602.1 billion.

Transpacific Eastbound
*Note: The ocean carriers have announced their next round of GRI’s and PSS (Peak Season Surcharge). Speculation with ocean carriers for January 15th GRI has already begun; levels are $240/20′, $300/40′, $340/40’HC, $380/45′.

SOURCES
Domestic & Global Economy
- “The Conference Board Leading Economic Index (LEI) for the U.S. Increased in October”– www.conference-board.org 11/27/13
- “Advance Monthly Sales For Retail And Food Services October 2013”–www.census.gov 11/20/13
- “Consumer Confidence in U.S. declines to a Seven-Month Low”– www.bloomberg.com 11/26/13
- “November 2013 Manufacturing ISM Report on Business” – www.ism.ws 12/02/13
- “November 2013 Non-Manufacturing ISM Report on Business”– www.ism.ws 12/04/13
- “ISM semiannual report paints a positive picture for 2014 growth” – www.logisticsmgmt.com 12/11/13
- “Employment Situation Summary”– www.bls.gov 12/06/13
- 12/12 “Broad Gains Seen in Retail Sales This September” – www.nrf.com 10/29/13
- “Advance Report on Durable Goods Manufacturers’ Shipments, Inventories and ders October 2013”– www.census.gov 11/27/13
- “New Residential Construction In October 2013”– www.census.gov 11/26/13
Truckload Capacity & Volumes
- “Cass Freight Index Report”– www.cassinfo.com – Nov 2013
- “ATA Truck Tonnage Index Decreased 2.8% in October”– www.truckline.com 11/19/13
- “Trucking employment surges as 8,400 jobs added in November” – www.overdriveonline.com 12/06/13
- “Three of five NAFTA transportation modes up in September”– www.thetrucker.com 12/09/13
- “DOT Freight Transportation Index Rises 5.3% in October”– www.ttnews.com 12/11/13
Global Market Update
- “Despite high inventory levels, Port Tracker report is positive about rest of 2013”– www.logisticsmgmt.com 12/10/13
- “Retail Imports Expected to Be Up 1.8 Percent for December, 2.3 Percent For The Year”– www.nrf.com 12/9/13
- “CASS/INNTRA Ocean Indexes Report”– www.cassinfo.com 11/19/13