ECONOMIC UPDATE
Institute for Supply Management (ISM) Manufacturing Report on Business:
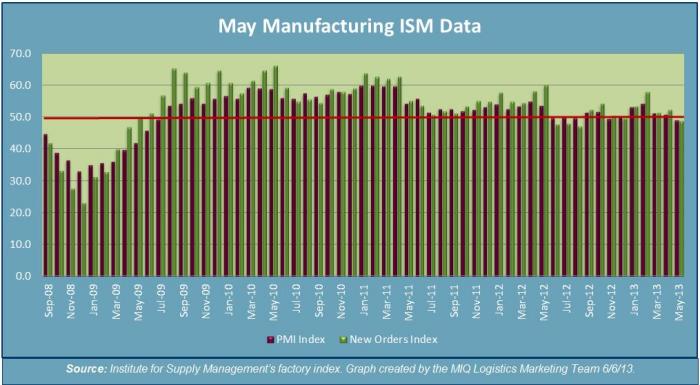
Economic activity in the manufacturing sector contracted to its lowest level since June 2009.
- 50 represents the dividing line between expansion and contraction for the index of the below chart; which covers the Purchasing Managers Index (PMI) and new orders.
- The PMI reading fell to 49.0 in May from 50.7 in April; this is below the expansion level.
- New Orders decreased in May by 3.5% to reach 48.8 on the index.

Expanding Manufacturing Industries
- Printing & Related Support Activities
- Nonmetallic Mineral Products
- Fabricated Metal Products
- Wood Products
- Apparel, Leather & Allied Products
- Food, Beverage & Tobacco Products
- Electrical Equipment
- Appliances & Components
- Machinery
- Paper Products

Contracting Manufacturing Industries
- Miscellaneous Manufacturing
- Transportation Equipment
- Chemical Products
- Plastics & Rubber Products
- Computer & Electronic Products
- Primary Metals
TRUCKLOAD CAPACITY
American Trucking Association: The ATA’s seasonally adjusted (SA) For-Hire Truck tonnage Index decreased 0.2% in April, following an increase of 0.9% in March. The report from the ATA shows that April’s SA was 123.2, which is up 4.3% on an annual basis.
- “The slight drop in tonnage during April fit with trends from other industries that drive a significant amount of truck freight, such as manufacturing and housing.” “After rising significantly late last year and in January of this year, truck tonnage has been bouncing around a narrow, but elevated band over the last three months.” “It is also worth noting that the year-over-year comparisons are much better than expected just a few months ago and I’m hearing good comments about freight so far in May.” – ATA Chief Economist Bob Costello.
Cass Freight Index: According to the Cass Freight Index for May, freight volumes in North American increased 2.9% from the previous month.
- YOY data shows that May 2013 was 0.3% lower in volumes than May 2012.
- The Cass Freight Index Report also states that freight expenditures increased 0.4% in May (month-over-month) and were down 2.6% from the same period a year ago.
Truckload Freight: According to TransCore DAT Load Boards, the spot market loads increased 6.1% in May. When compared YOY to May 2012 spot market freight volume dipped 9.9%. Truck capacity decreased 0.4% (compared to April); however capacity increased 24% compared to May 2012.
NAFTA: Trade: Freight flows (measured in current dollars) on all modes of transportation between the U.S. and its NAFTA partners, was down 4.0% in March (month-over-month from February) to $95.6 billion.
- Cross-border truckload freight accounted for 60% of the total freight moved between the U.S. and its NAFTA partners.
Trucking Employment: According to the Bureau of Labor Statistics, for-hire trucking companies lost 700 jobs in this sector in the month of May. However, there was an upward adjustment for the month of April which showed an increase of 700 jobs in this same sector. From a year-over-year perspective, trucking employment is up 3.0% from May 2012; or 39,900 new jobs.
U.S. IMPORT CONTAINER FORECAST

Global Port Tracker expecting gains in import volumes between May and August
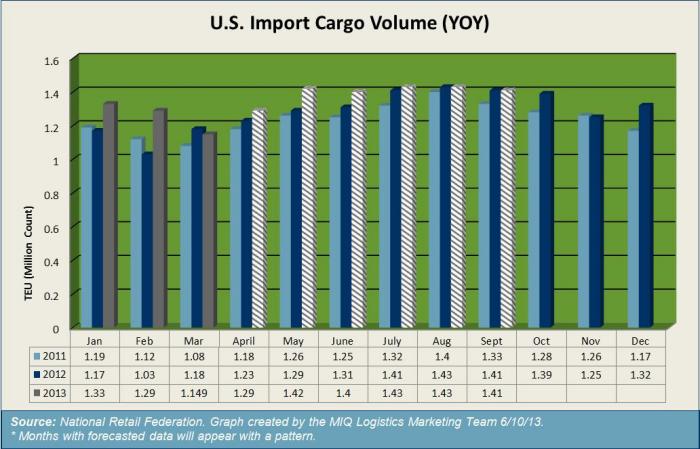
- March which was the last month for which Port Tracker has confirmed data; shows that 1.14 million TEU were imported into the U.S. This figure is down 10.9% month-over-month.
- May is forecasted to be up 3.3% (year-over-year), and June, July, August are expected to see percentage increases of 3.3%, 1.4%, and 1.45 respectfully.
- The first six months of 2013 are expected to total 7.8 million TEU, which is a 2% increase from the first half of 2012.
Global Market Update
| TPEB | 20′ | 40′ | 40′ HC | 45′ |
| USWC | $320.00 | $400.00 | $450.00 | $506.00 |
| IPI | $480.00 | $600.00 | $675.00 | $760.00 |
| USEC | $480.00 | $600.00 | $675.00 | $760.00 |
Overcapacity and weak demand are the running theme on Transpacific Eastbound:
- In a recent report from Drewry; it was reported that “the increases in Transpacific capacity are likely to cause the average 83 percent eastbound vessel utilization rate to fall below 80 percent by the end of May, which will further weaken carrier’s freight rate demands in annual contracts that are still being negotiated”.
- In the month of May, vessel capacity for Transpacific actually increased by 1.1 million (TEU: twenty-foot equivalent units) or 1.6% more capacity month-over-month from April.
- Alphaliner has recently indicated that the Asia-U.S. demand grew 1.5%, while capacity will be growing by 8.9% to the West Coast, and 2.2% to the East Coast.
- In an update from PR Newswire on 6/7/13, it was reported that since January of 2013, capacity deployment for the Transpacific Eastbound lanes was as follows:
- Current TEU deployment for Far East/U.S. West Coast = 248,209 TEU which is up 9.3% since the beginning of 2013.
- Current TEU deployment for Far East/U.S. East Coast = 99,947 TEU which is up 12.1% since the beginning of 2013. It is interesting to note that the TEU count was actually down 8.6% in September 2012.
European trade forecast for 2013:
The Global Port Tracker report from Hackett Associates and the Bremen Institute of Shipping Economics and Logistics have reported their survey findings for the six major container ports in Northern Europe:
- Ports surveyed: Le Havre, Antwerp, Zeebrugge, Rotterdam, Bremen/Bremerhaven, and Hamburg.
- For the year 2013 total imports to Europe are expected to increase 4.1 percent at 21.7 million TEU, while exports are forecasted to see a 6.4% increase at 18.1 million TEU.
SOURCES
Domestic & Global Economy
- “The Conference Board Consumer Confidence Index Improves in May”– www.conference-board.org 05/28/13
- “Employment Situation Summary”– www.bls.gov 06/07/13
- “May 2013 Manufacturing ISM Report on Bhttp://www.bloomberg.com/news/2013-05-16/housing-starts-in-u-s-decreased-in-april-to-five-month-low.htmlusiness”– www.ism.ws 06/03/13
- “Advance Monthly Sales for Retail and Food Services April 2013”–www.census.gov 05/13/13
- “Housing Starts in U.S. Fell in April to Five Month Low”– www.bloomberg.com 05/16/13
“Consumer Spending in U.S. Unexpectedly Declines in April”–www.bloomberg.com 05/31/13 - “Advance Report on Durable Goods Manufacturers’ Shipments, Inventories and Orders April 2013”– www.census.gov 05/24/13
- “U.S. Durable Goods Orders Rise 3.3 Percent in April”– www.business.time.com 05/24/13
- “The Conference Board Leading Economic Index”– www.conference-board.org 05/17/13
- “US May ISM Non-Mfg Index Rises to 53.7 Vs 53.1 In April”– www.online.wsj.com 06/05/13
Truckload Capacity & Volumes:
- “Unemployment drops; trucking adds 11,700 jobs”– www.thetrucker.com 06/07/13
- “Trucks carry 60% of $95.6B NAFTA freight in March; value down 4% from ‘12”–www.thetrucker.com 05/29/13
- “Cass Freight Index Report – May 2013”– www.cassinfo.com 06/04/13
- “Transcore DAT Trendlines”– www.dat.com 06/05/13
- “BTS Reports March Surface Trade with NAFTA Parters Falls 4.0 Percent Annually” –www.logisticsmgmt.com 05/29/13
- “ATA reports tonnage levels are mixed for April”– www.logisticsmgmt.com05/21/13
U.S. Import Container Forecast:
- “Retail Import Growth Expected to Slow Significantly over Summer”– www.nrf.com 05/14/13
- “Port Tracker report points to late summer slowdown”– www.logisticsmgmt.com 05/14/13
Global Market Update:
- “Transpacific carriers call for general rate increases”– www.bloomberg.com05/29/13
- “Transpacific rates beaten down by excess capacity and weak loads”–www.maritimeprofessional.com 05/29/13
- “Economic conditions still hindering European trade numbers, says Global Port Tracker report”– www.logisticsmgmt.com 05/30/13
- “Capacity Hikes Erode Carriers’ Rate Leverage, Drewry Says”– www.joc.com 05/28/13
- “Far East – U.S. Capacity Deployment Comparisons” – www.prnewsservice.com 06/07/13
