U.S. Department of Transportation
The Freight Transportation Services Index (TSI), which is based on the amount of freight carried by the for-hire transportation industry, rose 0.6 percent in June from May, rising for the third consecutive month, according to the U.S. Department of Transportation’s Bureau of Transportation Statistics’ (BTS). The June 2016 index level (122.3) was 29.1 percent above the April 2009 low during the most recent recession.
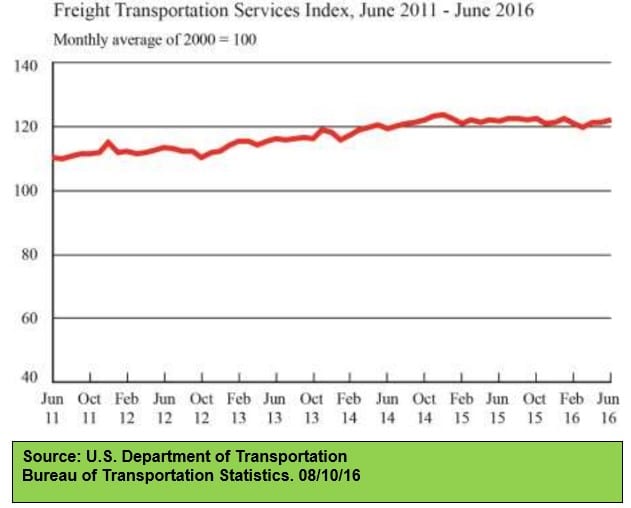
The level of freight shipments in June measured by the Freight TSI (122.3) was 1.1 percent below the all-time high level of 123.7 in December 2014
The May index was revised to 121.6 from 121.8 in last month’s release. The January index was revised down slightly. The Freight TSI measures the month-to-month changes in freight shipments by mode of transportation in tons and ton-miles, which are combined into one index. The index measures the output of the for-hire freight transportation industry and consists of data from for-hire trucking, rail, inland waterways, pipelines and air freight. Analysis: The June Freight TSI increase of 0.6 percent from May was broad in terms of mode. All freight modes grew except for water and rail intermodal which declined after significant rises in May. The June increase was driven by growth in in the mining (including oil and gas well drilling and servicing), utility and manufacturing sectors of the economy. The Federal Reserve Board Industrial Production index rose 0.6 percent in June. Housing starts were 4.8 percent above the May level and employment grew by 287,000 jobs. The second quarter TSI increase of 2.2 percent from the first quarter matched trends in the larger economy. Gross Domestic Product (GDP) growth increased at the moderate annual pace of 1.2
percent in the second quarter although Industrial Production declined during the quarter.
Trend: The 0.6 percent Freight TSI rise in June from May was the third consecutive monthly increase. The combined growth of 2.2 percent over the three months from March to June was the first time the TSI rose three months in succession since December 2014. The three months of successive increases followed two months of successive decline, leaving the June level 0.2 percent below the level of January 2016 and 1.1 percent below the December 2014 peak of 123.7.
The second quarter increase of 2.2 percent was the largest quarterly rise since the first quarter of 2013. It followed two quarters of decline and declines in four of the previous five quarters. The index remains high compared to earlier years, rising 29.1 percent since the low of 94.7 in April 2009. For additional historical data, go to TSI data.
>> Click here to read the entire release the U.S. Department of Transportation.